
No one can predict the future. What we can do instead is checking previous situations in the history of an asset to make an hypothesis regarding the future.
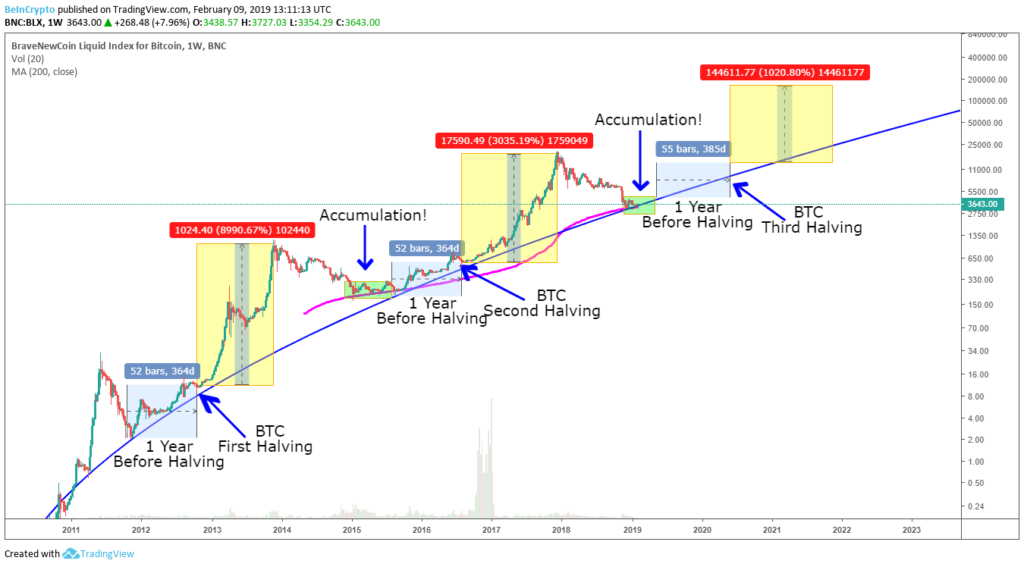
We are doing this with bitcoin. The halving of bitcoin is the moment (each 4 years) when the rewards to miner who mines a block (so the number of bitcoins created by mining a block) becomes half. At the moment (may 2019) the reward is 12,5 BTC. On may 2020 it will become the half, so 6,25 BTC. In the past, has you can see from the graph, this moment has been characterized by great rise in price.
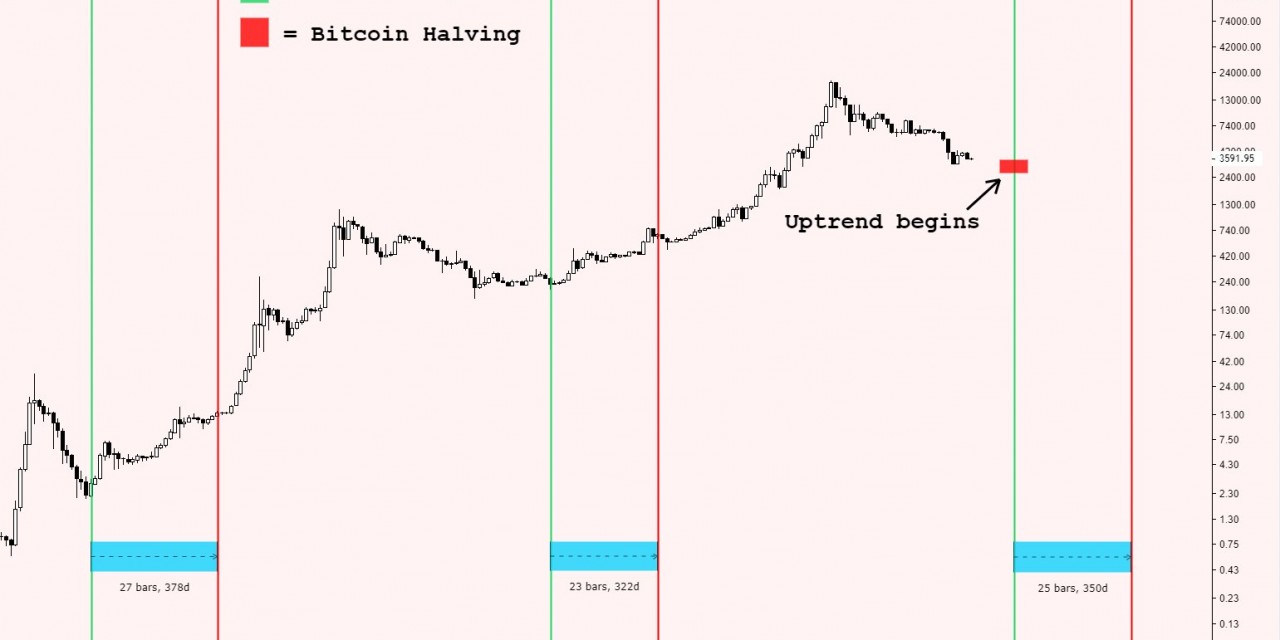
Infact in the graph you can see the halving lines (red) and the periods with great rise of the price afterwards. It is also visible the bear market following the peaks. Infact 2017 has been a bear year for bitcoin and we all know that.
If the bitcoin will follow the history or not in the next halving we dont know at the moment, but it’s clear that the graph is showing a lot of analogies and a cycle is clearly distinguishable.
Each halving event, the circulating bitcoin quantity slows down, having as result the raising of its value.
Obviously this happened only 2 two times, therefore we know that 2 is not a good number for statistics, but if you look at the graph you can discover a clear pattern in this 4 year’s cycle.
This is not a financial consult, this is just an hypothesis agreed by numerous traders in digital assets field. Graph courtesy by the owners


